- Research
- Open access
- Published:
Gait recognition based on the golden ratio
EURASIP Journal on Image and Video Processing volume 2016, Article number: 22 (2016)
Abstract
Gait is known to be an effective behavioral biometric trait for the identification of individuals. However, clothing has a dramatic influence on the recognition rate. Researchers have attempted to deal with this issue of clothing by segmenting parts of the gait images based on anatomical proportions. However, the clothing proportion is not the same as the anatomical proportion, as clothing is designed according to the golden ratio to enhance its look. Hence, methods for eliminating the influence of clothing should be based on the proportions of clothing. In this paper, we propose the golden ratio-based segmentation method to reduce the influence of clothing. Experiments are conducted on the CASIA-B dataset, and experimental results show that the proposed method outperforms other approaches, achieving a 94.76 % recognition rate in various clothing conditions and a rate of 91.53 % when bags are being carried.
1 Introduction
Compared with many biometric traits, such as fingerprint, iris, and hand geometry, gait can be captured from a distance. Gait recognition can be used in visual surveillance, forensics, robotics, computer animation, etc. However, there are many covariates [1–3] that influence the performance of gait recognition systems, such as clothing, carrying baggage, view angles, walking speed, elapsed time, and so on. Among these, the influence of clothing is generally unavoidable and has a considerable effect on the recognition rate. People generally change their clothes on a daily basis. Yu et al. [4] demonstrated that clothing caused the recognition rate to drop from more than 95 % to less than 33 %. Matovski et al. [5] also showed that clothing affects the recognition performance more than covariates such as time, footwear, and speed. Gafurov et al. [6], Hadid et al. [7], and Bustard et al. [8] researched the spoof attacks and anti-spoofing on gait recognition system. Hadid et al. [7] and Bustard et al. [8] showed that clothing is a big challenge for gait anti-spoofing. Hence, in this paper, we focus on a method for reducing the influence of clothes on gait recognition systems.
A number of researchers have used partial gait images, instead of the whole gait, to reduce the influence of clothing. For instance, Gabriel-Sanz et al. [9] used the lower portion of gait images to eliminate the problem caused by clothing, whereas Hossain et al. [10] and Li et al. [11] segmented the gait into different parts according to the anatomical proportion and used different parts for the recognition task. Some researchers have constructed a mask according to relative criterion to determine which part of the gait should be used for recognition [12, 13]. Recently, Guan et al. [14] proposed a random subspace method to deal with the covariate of clothing. Many previous studies attempted to discard the influenced parts and retain only those uninfluenced parts to eliminate the effects of clothing. However, this problem has not been considered in terms of the characteristics of clothing. In the clothing and fashion industry, based on the fact that the parts of the human body conform to golden ratio [15], such a ratio is commonly used to guide the design of different types of clothing [16, 17]. Based on this, we propose a golden ratio segmentation method to deal with the problems caused by clothing in gait recognition systems.
The remainder of this paper is organized as follows. Section 2 provides a brief review of the part-based methods and Section 3 provides analyses of those methods. The proposed golden ratio segmentation method is then described in Section 4. Some experimental results and analysis are presented in Section 5, and Section 6 summarizes our work and states our conclusions.
2 Review of part-based methods
Part-based methods use parts of the gait to realize gait recognition. They fall into three categories depending on the segmentation method employed, namely, anatomical proportion-based methods, self-defined methods, and mask-based methods.
The anatomical proportion-based method segments the body into different parts according to anatomical proportions [18]. Figure 1 illustrates the anatomical proportions and the main gait partitioning methods based on them. This approach is easy to implement and were employed by Hossain et al. [10], Li et al. [11], and Li et al. [19]. However, the proportions of the parts cannot be adjusted for different probe samples according to clothing length, which often affects the recognition rates.

Self-defined proportion methods use proportions defined by different authors. Figure 2 illustrates several examples. As shown in Fig. 2 a, Gabriel-Sanz et al. [9] used only the lower part of the human body for recognition. Similarly, Li and Chen [20] (Fig. 2 b) used the head and feet of the gait to construct a structural gait energy image (SGEI) for recognition, [21] used the top and bottom parts of gait as selected features to mitigate the effect of the covariates. These methods select a few parts which are assumed to be less affected by clothing. But some of the chosen parts are really affected by clothing, meanwhile, these methods miss some uninfluenced parts. As a result, this kind of methods cannot eliminate the influenced parts fully and cannot make full use of the uninfluenced data.

To enhance robustness and make full use of all data, some studies create a unique mask for each test sample, as shown in Fig. 3. Exactly, Fig. 3 a illustrates the approach of Whytock et al. [22], whereby a typical GEI was created using training data with typical clothing. For a given test sample, the probe and typical GEI are subtracted to identify the rows that could be used to realize the recognition. Figure 3 b shows a mask-based method combined with self-defined proportions [23]. Figure 3 c illustrates an approach in which the training set is used to define a mask that determines the parts to be used [13]. Mask-based methods are very robust and generally achieve high recognition rates. However, they are time consuming because the mask must be created and trained for each test sample. Moreover, the performance is influenced by the threshold value.

3 Analysis of part-based methods and problem statement
We design the following experiments to exhibit the weakness of part-base methods. We used the CASIA-B dataset [4], which includes video sequences covering 124 subjects. For each subject, there are ten sequences (six with normal clothes, two with carrying objects, and two with clothing changes) taken from 11 different view angles (from 0° to 180° at an interval of 18°). As in other studies, we use the view angle 90° and divide the dataset into three subsets. Set A includes the six normal-clothes samples for the 124 subjects, set B includes the samples with clothing changes, and set C includes samples with objects being carried.
GEI, the average silhouette in the complete gait cycle(s), is a popular appearance-based gait representation method [24]. Given N binary gait silhouette image frames, B t (x,y), the gray-level GEI is defined as:
Where N is the number of frames in the complete cycle(s) of a silhouette sequence, t is the frame number in the sequence (point in time), and (x,y) are the pixels coordinates. Zheng et al. [25] used GEI as the gait representation method, where the resolution of GEI is 240 × 240 pixels, we will also adopt it in our work. The dataset CASIA-B has already provided silhouettes, so we need not to segment the object from the video. The GEI can be gotten by the silhouettes and Eq. (1).
3.1 The contribution of different parts without the influence of clothing
3.1.1 Segmentation using existing proportions
The gait was divided into different parts using the proportions discussed in Section 2. Each part is described by its position within the whole gait image. For example, part (0:0.13) denotes the data from the top of the head down to 13 % of the height of the image, i.e., the head; the whole gait is thus described as (0:1). Using set A of the CASIA-B dataset, a sixfold cross-validation was employed to make the experimental results more robust, and two-dimensional principal component analysis (2DPCA) [26] was used to reduce the number of dimensions to 30. Classification was performed using a nearest neighbor (NN) [27] method. Table 1 presents experimental results. The third column in this table shows the percentage of data that refers to the whole gait. Columns 4–9 give the results for each cross-validation, and the tenth column lists the mean recognition rates.
From Table 1, we can see that without covariates, the use of most parts of the gait can achieve recognition rates higher than 95 %. In fact, most parts can be used independently or combinedly. Usually the later can get better performance. For example, part 15 is combined by part 2 and part 6, the use of part 15 get recognition rates (97.04 %) higher than those of using part 2 (84.68 %) or part 6 (93.82 %), similarly results for part 16 and 17. We also noticed that part 1 (the head) and part 13 (the foot and lower leg) attain lower recognition rates than the other parts. The reasons are people often lower their heads, and the feet can easily introduce errors during preprocessing. From Table 1, we can draw the following conclusions for data without the influence of clothing and other covariates: (1) most parts can be used independently for recognition; (2) The combined parts produce better performance.
3.1.2 Segmentation using equal proportions
We equally segment the gait into ten and five parts with intervals of 10 and 20 %, respectively (as shown in Fig. 4), and repeat the experiments of Section 3.1.1. Figure 4 shows that similar conclusions can be drawn. Parts can be used for recognition independently, and the 20 % data gives a higher recognition rate than any of the 10 % data which combined by. Table 1 and Fig. 4 lead to similar conclusions. The torso can be used to attain better recognition performance when it is unaffected by clothes, and combined parts give higher recognition rates than any of their constituent parts.

Recognition rate for equal segmentation on CASIA set A. The blue, green, and red bars illustrate the recognition rates for the use of 10,10, and 20 % of gait, respectively
3.2 The influence of clothing and feature extraction method
Next, we attempted to uncover how clothing and feature extraction method affects recognition rate. Set A of the CASIA-B dataset is used for training, and set B is used as the test data. The gait images were segmented into equally sized proportions (as in Section 3.1.2). Three commonly used feature extraction methods, 2DPCA [26], 2DDCT + 2DPCA [28], and 2DGabor + 2DPCA [29] were used to examine their influence on the results, NN was used to classify.
Experimental results are presented in Table 2. Figure 5 illustrates different clothing types. Compared with Fig. 4, Table 2 shows that, for the parts (ID = 3, 4, 5, 6, 7, 12, 13, and 14) which are covered by all types of clothing, the recognition rate dropped dramatically. While for the parts (ID = 2, 8, 9, 10, 11, 15 and 16) which are covered only by some types of clothing, the recognition rate dropped relatively milder. Combined the fact that there are different clothing types in the real life and the experimental results, we can know that, to eliminate the influence of clothing, the parts covered by coat should be discarded, and the other parts can be used for the recognition task.

The illustration of different clothing types and their corresponding location
In this section, several experiments were carried out. The experimental results show that without the influence of clothes, every part of the body can be used for recognition, but when the clothes changed, the influenced part should be discarded and only the uninfluenced part can be used for recognition. So the problem is to identify the clothes-affected parts for exclusion in the recognition process.
4 The proposed golden ratio-based method
Clothing is often designed using the golden ratio. Inspired by this rule, we propose the golden ratio-based method to eliminate the influence of clothes in gait recognition.
4.1 Golden ratio
The golden ratio is illustrated in Fig. 6, the ratio AB:AC (and the subset ratio AC:CB) is known as the golden ratio, the longer part of the line is approximately 61.8 % of the whole line. The point C, which divides the line, is called the golden point. This also can be illustrated using Eqs. (2)–(4).

Golden ratio. For a line segment AB, C is the golden point, a:b conforms to the golden ratio
4.2 Golden ratio in clothing design
The golden ratio is used in clothing design to make people look beautiful. We noticed that people wear certain types of clothing more frequently. These four main clothing types are: short (Fig. 7 a), normal (Fig. 7 b), long (Fig. 7 c), and longer (Fig. 7 d). The short types use golden point 2 referenced from H1 (from Adam’s apple to the bottom). The normal length corresponds to golden point 3 referenced to the central part H2 (from the Adam’s apple to the knee), and the long and longer types correspond to golden point 6 and golden point 8. These are referenced to the whole height H.

Four typical clothing types according to the golden ratio. a Short. b Normal. c Long. d Longer. H is the height of gait and GP stands for the golden point
4.3 Our method
Section 3 concluded that the coat covering parts should be discarded. Combined with the design of clothing that adheres to the golden ratio, we propose the golden ratio method. Considering the typical clothing types, the body can be segmented by golden points Gp7, Gp2, Gp3, Gp6, and Gp8 into six parts, as shown in Fig. 8. We use various subsets of these six parts, i.e., subset 1 (part 1, part 3, part 4, part 5, and part 6), subset 2 (part 1, part 4, part 5, and part 6), subset 3 (part 1, part 5, and part 6), subset 4 (part 1 and part 6), and subset 5 (part 1). Different subsets cover different cases, e.g., subsets 1–4 correspond to parts that exclude the four main clothing parts, respectively, subset 5 is the head and will be used for the clothing is longer than type 4. This is illustrated in Table 3. For different subsets, we trained the subset data and extracted the features of different subsets. For a probe sample, we distinguish the clothing type firstly, then combined the corresponding part into subset according clothing type i, extract the features, choose the corresponding subset features of training set, and use the classifier to obtain the recognition result. The process is illustrated in Fig. 9. Our method can be summarized as follows:
-
1.
Segment the GEI into six different parts according to the golden ratio and obtain the corresponding subsets, as shown in Fig. 8.
Fig. 8 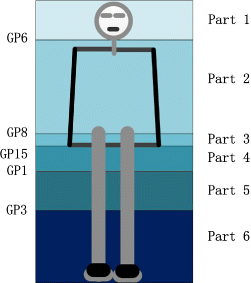
Segmentation of the body according to the golden ratio. Gait is segmented into six different parts
Fig. 9 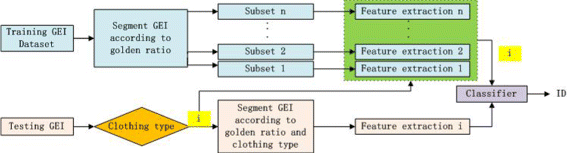
Flowchart of the proposed golden ratio method
Table 3 Clothing types and correspond parts -
2.
Extract features from different subsets and access the subset feature database.
-
3.
For a given probe sample, distinguish which clothing type the probe belongs to, using the corresponding subset data to determine the features of the sample.
-
4.
Use the features of the test sample and the corresponding training subset as two inputs of the classifier to obtain the recognition results.


4.4 Distinguishing clothing type
For a given test sample, we first distinguish the clothing type to know which parts should be retained and which should be discarded. Clothes are almost static in the GEI, so we use the static parts of the body to detect the area of clothing. We need only detect the lower bound of the clothes. We use the sum of static points in each row and its change to detect the lower edge and find the coordinates of the edge of the cloth. Generally, the lower bound of clothes is on or under Gp2. Hence, the bound area is (0.472H,H). For a given probe sample, if the length of the clothes is L t , the clothes lower bound of different clothes types are L 1, L 2, L 3, L 4, and L 5, while L 1<L 2<L 3<L 4<L 5, they correspond to the lower bound of short, normal, long, longer clothes, and full long (only head can be used), respectively. When the resolution is 240×240, the coordinates of the lower bounds of these clothing types are 113, 126, 148, 183, and 240. The clothing type T ct of testing sample is distinguished by the following function:
Equations (5) and (6) classify the test sample into a proper clothing type. If L 2<L t <L 3, then the clothing is type 3, and we use the parts relevant to type 3, i.e., part 1, part 5, and part 6, as the effective data. This process can be illustrated by Fig. 10. For a given testing sample like Fig. 10 a, the sum of each row in GEI was calculated firstly, as shown in Fig. 10 b. Secondly, the changes of sum between row 100 and 200 with the interval 7 were calculated, as shown in Fig. 10 c. Finally, the empirical threshold 2000 was used to detect the bottom of clothing, and the detected boundary was shown in Fig. 10 d. In this sample, the row’s number of the boundary is 147, so the clothing type should be type 3 according to Eqs. (5) and (6).

The process of detecting the clothing bottom boundary. a A given GEI. b The sum of line of GEI. c The changes of the sum between the line 100 and 200. d The detected bottom boundary of clothing
5 Experimental results and analysis
We test our method on CASIA-B dataset. Set A was used as the training set, with sets B and C as the test sets. A two-dimensional Gabor filter (2DGabor) was used to extract the features, and 2DPCA was used to reduce the number of feature dimensions to 30. For a given probe sample, we detected the lower bound of the clothes and distinguished the clothing type to determine which parts of the data should be used. For instance, if the clothing is of type 3, then parts 1, 5, and 6 will be used as the test data. The feature subset of the training data was then selected, and NN used to obtain the recognition results. Table 4 presents the experimental results.
Table 4 shows that our method performs better than the other methods, achieving a recognition rate of 94.76 % in clothing-change situations. When objects are being carried, the recognition rate was 91.53 %. The reason for this superior performance is that the golden ratio takes the characteristics of clothing into consideration, enabling all the clothing parts to be discarded and the unaffected parts of the gait to be retained. At the same time, each test sample was segmented according to its clothing type, which made the performance of the proposed method more robust.
Compared with the anatomical proportion-based method, such as [11], golden ratio-based method discarding all the affected parts and make full use of the unaffected data. Thus, the golden ratio-based method attains a higher recognition rate and is more robust.
Compared with self-defined proportion method, such as [20] and [21], the proposed method can keep more data than self-defined proportion method because it distinguish the clothing type before segmentation, and use different proportion for different probe sample.
Compared with mask-based methods, such as [23] and [22], the proposed method achieves better recognition performance. This is because the golden ratio method discards the whole rows instead of parts of rows, thus completely discarding the areas affected by clothing. As clothes not only influence the static part, but also the motion part of the gait, the whole influenced row should be discarded. The golden ratio method has the merits of mask-based methods, segmenting according to the test sample, which makes it flexible and robust. However, the proposed method does not require a training procedure for each test sample.
The proposed method is quite simple. Though detecting the clothing boundary involves some time, the usage of parts instead of whole gait saves some time. Hence, the proposed method would not increase the computational complexity of the gait recognition system. Different from [21] which conducts recognition process multiple times to find the boundary of top and bottom part, the proposed method only conducts once.
6 Conclusions
In this paper, we first have investigated the contribution of different parts of gait with and without the influence of clothing. We found that the key problem is to find out the exact part of clothing, and discard it. Considering that the human body conforms to the golden ratio, and that clothing are designed according to this ratio, we proposed the golden ratio segmentation method to eliminate the influence of clothing. Experimental results have shown that our method performs better than other methods, achieving a 94.76 % recognition rate in clothing change situations and 91.53 % when bag being carried on the CASIA-B dataset.
References
S Sarkar, PJ Phillips, Z Liu, IR Vega, P Grother, KW Bowyer, The human id gait challenge problem: data sets, performance and analysis. IEEE Trans. Pattern. Anal. Mach. Intell.27:, 162–177 (2005).
D Xu, Y Huang, Z Zeng, X Xu, Human gait recognition using patch distribution feature and locality-constrained group sparse representation. IEEE Trans. Image Process.21:, 316–326 (2012).
L Wang, G Zhao, N Rajpoot, MS Nixon, Special issue on new advances in video-based gait analysis and applications: challenges and solutions. IEEE Trans. Syst. Man Cybern. B Cybern.40:, 982–985 (2010).
S Yu, D Tan, T Tan, in Proceeding Of the 18th Internaional Conference on Patern Recognition(ICPR). A framework for evaluating the effect of view angle, clothing and carrying condition on gait recognition (IEEEHong Kong, 2006), pp. 441–444.
DS Matovski, MS Nixon, S Mahmoodi, JN Carter, The effect of time on gait recognition performance. IEEE Trans. Inf. Forensic Secur.7:, 543–552 (2012).
D Gafurov, E Snekkenes, P Bours, Spoof attacks on gait authentication system. IEEE Trans. Inf. Forensic Secur.2:, 491–501 (2007).
A Hadid, M Ghahramani, V Kellokumpu, M Pietikainen, J Bustard, M Nixon, in 21st International Conference on Pattern Recognition (ICPR 2012). Can Gait Biometrics Be Spoofed? (IEEETsukuba, 2012), pp. 3280–3283.
JD Bustard, M Ghahramani, JN Carter, A Hadid, MS Nixon, in Handbook of Biometric Anti-Spoofing. Gait anti-spoofing. Handbook of Biometric Anti-Spoofing (Springer London, 2014), pp. 147–163. http://link.springer.com/chapter/10.1007%2F978-1-4471-6524-8_8.
S Gabriel-Sanz, R Vera-Rodriguez, P Tome, J Fierrez, in IEEE International Workshop on Biometrics and Forensics(IWBF). Assessment of Gait Recogniton Based on the Lower Part of the Human Body (IEEELisbon, 2013), pp. 1–4.
MA Hossain, Y Makihara, J Wang, Y Yagi, Clothing invariant gait identification using part-based clothing categorization and adaptive weight control. Pattern Recogn.43:, 2281–2291 (2010).
N Li, Y Xu, X Yang, in Proceeding of the Ninth International Conference on Machine Learning and Cybernetics. Part-based Human Gait Identification Under Clothing and Carrying Condition Variations (IEEEQingdao, 2010), pp. 268–273.
Y Dupuis, X Savatier, P Vasseur, Feature subset selection applied to model-free gait recognition. Image Vis. Comput.31:, 580–591 (2013).
M Rokanujjaman, MA Hossain, MR Islam, MS Islam, in 2013 International Conference on Informatics, Electronics Vision. Effective Part Definition for Gait Identification Using Gait Entropy Image (IEEEDhaka, 2013), pp. 1–4.
Y Guan, C-T Li, F Roli, On reducing the effect of covariate factors in gait recognition: a classifier ensemble method. IEEE Trans. Pattern Anal. Mach. Intell.37:, 1521–1528 (2015).
TA Davis, R Altevogt, Golden mean of the human body, (1979). http://www.fq.math.ca/Scanned/17-4/davis-a.pdf. Accessed 8 Aug 2016.
S Lian-ying, Analysis of the golden section in garment sculpt design effect. Jiangxi Sci.31:, 816–819 (2013).
Z Kazlacheva, J Ilieva, in International Symposium in Knitting and Apparel - Iska. The Golden Triangle in Fashion Design (ISKALasi, 2013), pp. 187–193.
WT Dempster, GRL Gaughran, Properties of body segments based on size and weight. Am. J. Anat.120(1), 1651–1662 (1967).
X Li, SJ Maybank, S Yan, D Tao, D Xu, Gait components and their application to gender recognition. IEEE Trans. Syst. Man Cybern.38:, 145–155 (2008).
X Li, Y Chen, Gait recognition based on structural gait enery image. J. Comput. Inf. Syst.9:, 121–126 (2013).
SA Imad Rida, A Bouridane, Gait recognition based on modified phase-only correlation. SIViP. 10:, 463–470 (2016).
TP Whytock, A Belyaev, NM Robertson, in ISVC. Towards Robust Gait Recognition (SpringerRethymnon, 2013), pp. 523–531. http://link.springer.com/content/pdf/10.1007%2F978-3-642-41939-3.pdf.
K Bashir, T Xiang, S Gong, Gait recognition without subject cooperation. Pattern Recogn. Lett.31:, 2052–2060 (2010).
J Han, B Bhanu, Individual recognition using gait energy image. IEEE Trans. Pattern Anal. Mach. Intell.28:, 316–322 (2006).
S Zheng, J Zhang, K Huang, R He, T Tan, in International Conference on Image Processing(ICIP). Robust View Transformation Model for Gait Recognition (IEEEBrussels, 2011), pp. 2073–2076.
J Yang, D Zhang, AF Frangi, J Yang, Two-dimensional pca: a new approach to appearance-based face representation and recogniton. IEEE Trans. Pattern Anal. Mach. Intell.26:, 131–137 (2004).
TM Cover, PE Hart, Nearest neighbor pattern classification. IEEE Trans. Inf. Theory. 13:, 21–27 (1967).
M Bengherabi, L Mezai, F Harizi, 2dpca based techniques in dct domain for face recognition. Int. J. Intell. Syst. Technol. Appl.7:, 243–269 (2009).
D Tao, X Li, X Wu, SJ Maybank, General tensor discriminant analysis and gabor features for gait recognition. IEEE Trans. Pattern Anal. Mach. Intell.29:, 1700–1715 (2007).
X Huang, NV Boulgouris, Gait recognition with shifted energy image and structure feature extraction. IEEE Trans. Image Process.21:, 2256–2268 (2012).
W Kusakunniran, Recognizing gaits on spatio-temporal feature domain. IEEE Trans. Inf. Forensics Secur.9:, 1416–1423 (2014).
Acknowledgements
This work is jointly sponsored by the China Scholarship Council (CSC) No. 201306155008 and EU Horizon 2020 - Marie Sk lodowska-Curie Actions (Project No. 690907). The CASIA Gait Database was collected by the Institute of Automation, Chinese Academy of Science.
Authors’contribution
YLL designed the algorithm, carried out the experiments, and drafted the manuscript. CL gave suggestions on the design of the experiments and participated in modifying the manuscript. YG participated in the design of the experiments and helped draft the manuscript. YJH gave suggestions on the structure of manuscript writing and experiment analysis as well as explanation. All authors read and approved the final manuscript.
Competing interests
The authors declare that they have no competing interests.
Author information
Authors and Affiliations
Corresponding author
Rights and permissions
Open Access This article is distributed under the terms of the Creative Commons Attribution 4.0 International License (http://creativecommons.org/licenses/by/4.0/), which permits unrestricted use, distribution, and reproduction in any medium, provided you give appropriate credit to the original author(s) and the source, provide a link to the Creative Commons license, and indicate if changes were made.
About this article

Cite this article
Liang, Y., Li, CT., Guan, Y. et al. Gait recognition based on the golden ratio. J Image Video Proc. 2016, 22 (2016). https://doi.org/10.1186/s13640-016-0126-5
Received:
Accepted:
Published:
DOI: https://doi.org/10.1186/s13640-016-0126-5