- Research
- Open access
- Published:
Application research of digital media image processing technology based on wavelet transform
EURASIP Journal on Image and Video Processing volume 2018, Article number: 138 (2018)
Abstract
With the development of information technology, people access information more and more rely on the network, and more than 80% of the information in the network is replaced by multimedia technology represented by images. Therefore, the research on image processing technology is very important, but most of the research on image processing technology is focused on a certain aspect. The research results of unified modeling on various aspects of image processing technology are still rare. To this end, this paper uses image denoising, watermarking, encryption and decryption, and image compression in the process of image processing technology to carry out unified modeling, using wavelet transform as a method to simulate 300 photos from life. The results show that unified modeling has achieved good results in all aspects of image processing.
1 Introduction
With the increase of computer processing power, people use computer processing objects to slowly shift from characters to images. According to statistics, today’s information, especially Internet information, transmits and stores more than 80% of the information. Compared with the information of the character type, the image information is much more complicated, so it is more complicated to process the characters on the computer than the image processing. Therefore, in order to make the use of image information safer and more convenient, it is particularly important to carry out related application research on image digital media. Digital media image processing technology mainly includes denoising, encryption, compression, storage, and many other aspects.
The purpose of image denoising is to remove the noise of the natural frequency in the image to achieve the characteristics of highlighting the meaning of the image itself. Because of the image acquisition, processing, etc., they will damage the original signal of the image. Noise is an important factor that interferes with the clarity of an image. This source of noise is varied and is mainly derived from the transmission process and the quantization process. According to the relationship between noise and signal, noise can be divided into additive noise, multiplicative noise, and quantization noise. In image noise removal, commonly used methods include a mean filter method, an adaptive Wiener filter method, a median filter, and a wavelet transform method. For example, the image denoising method performed by the neighborhood averaging method used in the literature [1,2,3] is a mean filtering method which is suitable for removing particle noise in an image obtained by scanning. The neighborhood averaging method strongly suppresses the noise and also causes the ambiguity due to the averaging. The degree of ambiguity is proportional to the radius of the field. The Wiener filter adjusts the output of the filter based on the local variance of the image. The Wiener filter has the best filtering effect on images with white noise. For example, in the literature [4, 5], this method is used for image denoising, and good denoising results are obtained. Median filtering is a commonly used nonlinear smoothing filter that is very effective in filtering out the salt and pepper noise of an image. The median filter can both remove noise and protect the edges of the image for a satisfactory recovery. In the actual operation process, the statistical characteristics of the image are not needed, which brings a lot of convenience. For example, the literature [6,7,8] is a successful case of image denoising using median filtering. Wavelet analysis is to denoise the image by using the wavelet’s layering coefficient, so the image details can be well preserved, such as the literature [9, 10].
Image encryption is another important application area of digital image processing technology, mainly including two aspects: digital watermarking and image encryption. Digital watermarking technology directly embeds some identification information (that is, digital watermark) into digital carriers (including multimedia, documents, software, etc.), but does not affect the use value of the original carrier, and is not easily perceived or noticed by a human perception system (such as a visual or auditory system). Through the information hidden in the carrier, it is possible to confirm the content creator, the purchaser, transmit the secret information, or determine whether the carrier has been tampered with. Digital watermarking is an important research direction of information hiding technology. For example, the literature [11, 12] is the result of studying the image digital watermarking method. In terms of digital watermarking, some researchers have tried to use wavelet method to study. For example, AH Paquet [13] and others used wavelet packet to carry out digital watermark personal authentication in 2003, and successfully introduced wavelet theory into digital watermark research, which opened up a new idea for image-based digital watermarking technology. In order to achieve digital image secrecy, in practice, the two-dimensional image is generally converted into one-dimensional data, and then encrypted by a conventional encryption algorithm. Unlike ordinary text information, images and videos are temporal, spatial, visually perceptible, and lossy compression is also possible. These features make it possible to design more efficient and secure encryption algorithms for images. For example, Z Wen [14] and others use the key value to generate real-value chaotic sequences, and then use the image scrambling method in the space to encrypt the image. The experimental results show that the technology is effective and safe. YY Wang [15] et al. proposed a new optical image encryption method using binary Fourier transform computer generated hologram (CGH) and pixel scrambling technology. In this method, the order of pixel scrambling and the encrypted image are used as keys for decrypting the original image. Zhang X Y [16] et al. combined the mathematical principle of two-dimensional cellular automata (CA) with image encryption technology and proposed a new image encryption algorithm. The image encryption algorithm is convenient to implement, has good security, large key amount, good avalanche effect, high degree of confusion, diffusion characteristics, simple operation, low computational complexity, and high speed.
In order to realize the transmission of image information quickly, image compression is also a research direction of image application technology. The information age has brought about an “information explosion” that has led to an increase in the amount of data, so that data needs to be effectively compressed regardless of transmission or storage. For example, in remote sensing technology, space probes use compression coding technology to send huge amounts of information back to the ground. Image compression is the application of data compression technology on digital images. The purpose of image compression is to reduce redundant information in image data and store and transmit data in a more efficient format. Through the unremitting efforts of researchers, image compression technology is now maturing. For example, Lewis A S [17] hierarchically encodes the transformed coefficients, and designs a new image compression method based on the local estimation noise sensitivity of the human visual system (HVS). The algorithm can be easily mapped to 2-D orthogonal wavelet transform to decompose the image into spatial and spectral local coefficients. Devore R A [18] introduced a novel theory to analyze image compression methods based on wavelet decomposition compression. Buccigrossi R W [19] developed a probabilistic model of natural images based on empirical observations of statistical data in the wavelet transform domain. The wavelet coefficient pairs of the basis functions corresponding to adjacent spatial locations, directions, and scales are found to be non-Gaussian in their edges and joint statistical properties. They proposed a Markov model that uses linear predictors to interpret these dependencies, where amplitude is combined with multiplicative and additive uncertainty and indicates that it can interpret statistical data for various images, including photographic images, graphic images, and medical images. In order to directly prove the efficacy of the model, an image encoder called Embedded Prediction Wavelet Image Coder (EPWIC) was constructed in their research. The subband coefficients use a non-adaptive arithmetic coder to encode a bit plane at a time. The encoder uses the conditional probability calculated from the model to sort the bit plane using a greedy algorithm. The algorithm considers the MSE reduction for each coded bit. The decoder uses a statistical model to predict coefficient values based on the bits it has received. Although the model is simple, the rate-distortion performance of the encoder is roughly equivalent to the best image encoder in the literature.
From the existing research results, we find that today’s digital image-based application research has achieved fruitful results. However, this kind of results mainly focus on methods, such as deep learning [20, 21], genetic algorithm [22, 23], fuzzy theory, etc. [24, 25], which also includes the method of wavelet analysis. However, the biggest problem in the existing image application research is that although the existing research on digital multimedia has achieved good research results, there is also a problem. Digital multimedia processing technology is an organic whole. From denoising, compression, storage, encryption, decryption to retrieval, it should be a whole, but the current research results basically study a certain part of this whole. Therefore, although one method is superior in one of the links, it is not necessary whether this method will be suitable for other links. Therefore, in order to solve this problem, this thesis takes digital image as the research object; realizes unified modeling by three main steps of encryption, compression, and retrieval in image processing; and studies the image processing capability of multiple steps by one method.
Wavelet transform is a commonly used digital signal processing method. Since the existing digital signals are mostly composed of multi-frequency signals, there are noise signals, secondary signals, and main signals in the signal. In the image processing, there are also many research teams using wavelet transform as a processing method, introducing their own research and achieving good results. So, can we use wavelet transform as a method to build a model suitable for a variety of image processing applications?
In this paper, the wavelet transform is used as a method to establish the denoising encryption and compression model in the image processing process, and the captured image is simulated. The results show that the same wavelet transform parameters have achieved good results for different image processing applications.
2 Method
2.1 Image binarization processing method
The gray value of the point of the image ranges from 0 to 255. In the image processing, in order to facilitate the further processing of the image, the frame of the image is first highlighted by the method of binarization. The so-called binarization is to map the point gray value of the image from the value space of 0–255 to the value of 0 or 255. In the process of binarization, threshold selection is a key step. The threshold used in this paper is the maximum between-class variance method (OTSU). The so-called maximum inter-class variance method means that for an image, when the segmentation threshold of the current scene and the background is t, the pre-attraction image ratio is w0, the mean value is u0, the background point is the image ratio w1, and the mean value is u1. Then the mean of the entire image is:
The objective function can be established according to formula 1:
The OTSU algorithm makes g(t) take the global maximum, and the corresponding t when g(t) is maximum is called the optimal threshold.
2.2 Wavelet transform method
Wavelet transform (WT) is a research result of the development of Fourier transform technology, and the Fourier transform is only transformed into different frequencies. The wavelet transform not only has the local characteristics of the Fourier transform but also contains the transform frequency result. The advantage of not changing with the size of the window. Therefore, compared with the Fourier transform, the wavelet transform is more in line with the time-frequency transform. The biggest characteristic of the wavelet transform is that it can better represent the local features of certain features with frequency, and the scale of the wavelet transform can be different. The low-frequency and high-frequency division of the signal makes the feature more focused. This paper mainly uses wavelet transform to analyze the image in different frequency bands to achieve the effect of frequency analysis. The method of wavelet transform can be expressed as follows:
Where ψ(t) is the mother wavelet, a is the scale factor, and τ is the translation factor.
Because the image signal is a two-dimensional signal, when using wavelet transform for image analysis, it is necessary to generalize the wavelet transform to two-dimensional wavelet transform. Suppose the image signal is represented by f(x, y), ψ(x, y) represents a two-dimensional basic wavelet, and ψa, b, c(x, y) represents the scale and displacement of the basic wavelet, that is, ψa, b, c(x, y) can be calculated by the following formula:
According to the above definition of continuous wavelet, the two-dimensional continuous wavelet transform can be calculated by the following formula:
Where \( \overline{\psi \left(x,y\right)} \) is the conjugate of ψ(x, y).
2.3 Digital water mark
According to different methods of use, digital watermarking technology can be divided into the following types:
Spatial domain approach: A typical watermarking algorithm in this type of algorithm embeds information into the least significant bits (LSB) of randomly selected image points, which ensures that the embedded watermark is invisible. However, due to the use of pixel bits whose images are not important, the robustness of the algorithm is poor, and the watermark information is easily destroyed by filtering, image quantization, and geometric deformation operations. Another common method is to use the statistical characteristics of the pixels to embed the information in the luminance values of the pixels.
The method of transforming the domain: first calculate the discrete cosine transform (DCT) of the image, and then superimpose the watermark on the front k coefficient with the largest amplitude in the DCT domain (excluding the DC component), usually the low-frequency component of the image. If the first k largest components of the DCT coefficients are represented as D =, i = 1, ..., k, and the watermark is a random real sequence W =, i = 1, ..., k obeying the Gaussian distribution, then the watermark embedding algorithm is di = di(1 + awi), where the constant a is a scale factor that controls the strength of the watermark addition. The watermark image I is then obtained by inverse transforming with a new coefficient. The decoding function calculates the discrete cosine transform of the original image I and the watermark image I*, respectively, and extracts the embedded watermark W*, and then performs correlation test to determine the presence or absence of the watermark.
Compressed domain algorithm: The compressed domain digital watermarking system based on JPEG and MPEG standards not only saves a lot of complete decoding and re-encoding process but also has great practical value in digital TV broadcasting and video on demand (VOD). Correspondingly, watermark detection and extraction can also be performed directly in the compressed domain data.
The wavelet transform used in this paper is the method of transform domain. The main process is: assume that x(m, n) is a grayscale picture of M*N, the gray level is 2a, where M, N and a are positive integers, and the range of values of m and n is defined as follows: 1 ≤ m ≤ M, 1 ≤ n ≤ N. For wavelet decomposition of this image, if the number of decomposition layers is L (L is a positive integer), then 3*L high-frequency partial maps and a low-frequency approximate partial map can be obtained. Then Xk, L can be used to represent the wavelet coefficients, where L is the number of decomposition layers, and K can be represented by H, V, and D, respectively, representing the horizontal, vertical, and diagonal subgraphs. Because the sub-picture distortion of the low frequency is large, the picture embedded in the watermark is removed from the picture outside the low frequency.
In order to realize the embedded digital watermark, we must first divide XK, L(mi, nj) into a certain size, and use B(s, t) to represent the coefficient block of size s*t in XK, L(mi, nj). Then the average value can be expressed by the following formula:
Where ∑B(s, t) is the cumulative sum of the magnitudes of the coefficients within the block.
The embedding of the watermark sequence w is achieved by the quantization of AVG.
The interval of quantization is represented by Δl according to considerations of robustness and concealment. For the low-level Lth layer, since the coefficient amplitude is large, a larger interval can be set. For the other layers, starting from the L-1 layer, they are successively decremented.
According to wi = {0, 1}, AVG is quantized to the nearest singular point, even point, D(i, j) is used to represent the wavelet coefficients in the block, and the quantized coefficient is represented by D(i, j)', where i = 1, 2,. ..,s;j = 1,2,...,t. Suppose T = AVG/Δl, TD = rem(|T|, 2), where || means rounding and rem means dividing by 2 to take the remainder.
According to whether TD and wi are the same, the calculation of the quantized wavelet coefficient D(i, j)' can be as follows:
Using the same wavelet base, an image containing the watermark is generated by inverse wavelet transform, and the wavelet base, the wavelet decomposition layer number, the selected coefficient region, the blocking method, the quantization interval, and the parity correspondence are recorded to form a key.
The extraction of the watermark is determined by the embedded method, which is the inverse of the embedded mode. First, wavelet transform is performed on the image to be detected, and the position of the embedded watermark is determined according to the key, and the inverse operation of the scramble processing is performed on the watermark.
2.4 Evaluation method
Filter normalized mean square error
In order to measure the effect before and after filtering, this paper chooses the normalized mean square error M description. The calculation method of M is as follows:
where N1 and N2 are Pixels before and after normalization.
Normalized cross-correlation function
The normalized cross-correlation function is a classic algorithm of image matching algorithm, which can be used to represent the similarity of images. The normalized cross-correlation is determined by calculating the cross-correlation metric between the reference map and the template graph, generally expressed by NC(i,j). If the NC value is larger, it means that the similarity between the two is greater. The calculation formula for the cross-correlation metric is as follows:
where T(m,n) is the nth row of the template image, the mth pixel value; S(i,j) is the part under the template cover, and i,j is the coordinate of the lower left corner of the subgraph in the reference picture S.
Normalize the above formula NC according to the following formula:
Peak signal-to-noise ratio
Peak signal-to-noise ratio is often used as a measure of signal reconstruction quality in areas such as image compression, which is often simply defined by mean square error (MSE). Two m × n monochrome images I and K, if one is another noise approximation, then their mean square error is defined as:
Then the peak signal-to-noise ratio PSNR calculation method is:
Where Max is the maximum value of the pigment representing the image.
Information entropy
For a digital signal of an image, the frequency of occurrence of each pixel is different, so it can be considered that the image digital signal is actually an uncertainty signal. For image encryption, the higher the uncertainty of the image, the more the image tends to be random, the more difficult it is to crack. The lower the rule, the more regular it is, and the more likely it is to be cracked. For a grayscale image of 256 levels, the maximum value of information entropy is 8, so the more the calculation result tends to be 8, the better.
The calculation method of information entropy is as follows:
Correlation
Correlation is a parameter describing the relationship between two vectors. This paper describes the relationship between two images before and after image encryption by correlation. Assuming p(x, y) represents the correlation between pixels before and after encryption, the calculation method of p(x, y) can be calculated by the following formula:
3 Experiment
3.1 Image parameter
The images used in this article are all from the life photos, the shooting tool is Huawei meta 10, the picture size is 1440*1920, the picture resolution is 96 dbi, the bit depth is 24, no flash mode, there are 300 pictures as simulation pictures, all of which are life photos, and no special photos.
3.2 System environment
The computer system used in this simulation is Windows 10, and the simulation software used is MATLAB 2014B.
3.3 Wavelet transform-related parameters
For unified modeling, the wavelet decomposition used in this paper uses three layers of wavelet decomposition, and Daubechies is chosen as the wavelet base. The Daubechies wavelet is a wavelet function constructed by the world-famous wavelet analyst Ingrid Daubechies. They are generally abbreviated as dbN, where N is the order of the wavelet. The support region in the wavelet function Ψ(t) and the scale function ϕ(t) is 2 N-1, and the vanishing moment of Ψ(t) is N. The dbN wavelet has good regularity, that is, the smooth error introduced by the wavelet as a sparse basis is not easy to be detected, which makes the signal reconstruction process smoother. The characteristic of the dbN wavelet is that the order of the vanishing moment increases with the increase of the order (sequence N), wherein the higher the vanishing moment, the better the smoothness, the stronger the localization ability of the frequency domain, and the better the band division effect. However, the support of the time domain is weakened, and the amount of calculation is greatly increased, and the real-time performance is deteriorated. In addition, except for N = 1, the dbN wavelet does not have symmetry (i.e., nonlinear phase), that is, a certain phase distortion is generated when the signal is analyzed and reconstructed. N = 3 in this article.
4 Results and discussion
4.1 Results 1: image filtering using wavelet transform
In the process of image recording, transmission, storage, and processing, it is possible to pollute the image signal. The digital signal transmitted to the image will appear as noise. These noise data will often become isolated pixels. One-to-one isolated points, although they do not destroy the overall external frame of the image, but because these isolated points tend to be high in frequency, they are portable on the image as a bright spot, which greatly affects the viewing quality of the image, so to ensure the effect of image processing, the image must be denoised. The effective method of denoising is to remove the noise of a certain frequency of the image by filtering, but the denoising must ensure that the noise data can be removed without destroying the image. Figure 1 is the result of filtering the graph using the wavelet transform method. In order to test the wavelet filtering effect, this paper adds Gaussian white noise to the original image. Comparing the white noise with the frequency analysis of the original image, it can be seen that after the noise is added, the main image frequency segment of the original image is disturbed by the noise frequency, but after filtering using the wavelet transform, the frequency band of the main frame of the original image appears again. However, the filtered image does not change significantly compared to the original image. The normalized mean square error before and after filtering is calculated, and the M value before and after filtering is 0.0071. The wavelet transform is well protected to protect the image details, and the noise data is better removed (the white noise is 20%).
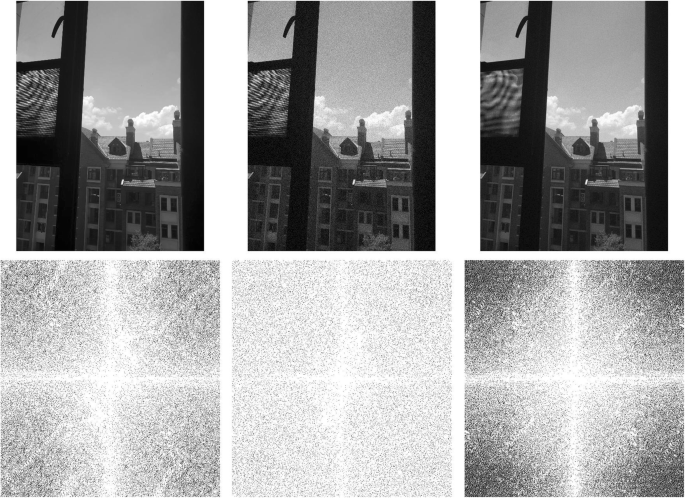
Image denoising results comparison. (The first row from left to right are the original image, plus the noise map and the filtered map. The second row from left to right are the frequency distribution of the original image, the frequency distribution of the noise plus the filtered Frequency distribution)
4.2 Results 2: digital watermark encryption based on wavelet transform
As shown in Fig. 2, the watermark encryption process based on wavelet transform can be seen from the figure. Watermarking the image by wavelet transform does not affect the structure of the original image. The noise is 40% of the salt and pepper noise. For the original image and the noise map, the wavelet transform method can extract the watermark well.

Comparison of digital watermark before and after. (The first row from left to right are the original image, plus noise and watermark, and the noise is removed; the second row are the watermark original, the watermark extracted from the noise plus watermark, and the watermark extracted after denoising)
According to the method described in this paper, the image correlation coefficient and peak-to-noise ratio of the original image after watermarking are calculated. The correlation coefficient between the original image and the watermark is 0.9871 (the first column and the third column in the first row in the figure). The watermark does not destroy the structure of the original image. The signal-to-noise ratio of the original picture is 33.5 dB, and the signal-to-noise ratio of the water-jet printing is 31.58SdB, which proves that the wavelet transform can achieve watermark hiding well. From the second row of watermarking results, the watermark extracted from the image after noise and denoising, and the original watermark correlation coefficient are (0.9745, 0.9652). This shows that the watermark signal can be well extracted after being hidden by the wavelet transform.
4.3 Results 3: image encryption based on wavelet transform
In image transmission, the most common way to protect image content is to encrypt the image. Figure 3 shows the process of encrypting and decrypting an image using wavelet transform. It can be seen from the figure that after the image is encrypted, there is no correlation with the original image at all, but the decrypted image of the encrypted image reproduces the original image.
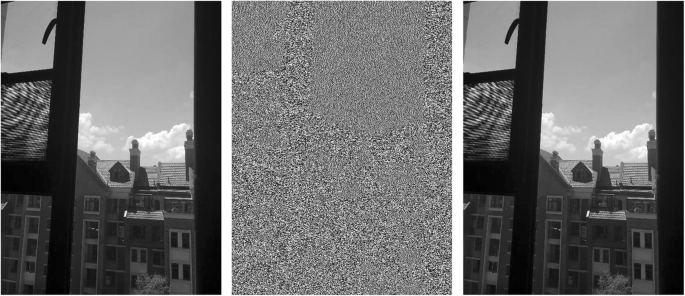
Image encryption and decryption process diagram comparison. (The left is the original image, the middle is the encrypted image, the right is the decryption map)
The information entropy of Fig. 3 is calculated. The results show that the information entropy of the original image is 3.05, the information entropy of the decrypted graph is 3.07, and the information entropy of the encrypted graph is 7.88. It can be seen from the results of information entropy that before and after encryption. The image information entropy is basically unchanged, but the information entropy of the encrypted image becomes 7.88, indicating that the encrypted image is close to a random signal and has good confidentiality.
4.4 Result 4: image compression
Image data can be compressed because of the redundancy in the data. The redundancy of image data mainly manifests as spatial redundancy caused by correlation between adjacent pixels in an image; time redundancy due to correlation between different frames in an image sequence; spectral redundancy due to correlation of different color planes or spectral bands. The purpose of data compression is to reduce the number of bits required to represent the data by removing these data redundancy. Since the amount of image data is huge, it is very difficult to store, transfer, and process, so the compression of image data is very important. Figure 4 shows the result of two compressions of the original image. It can be seen from the figure that although the image is compressed, the main frame of the image does not change, but the image sharpness is significantly reduced. The Table 1 shows the compressed image properties.
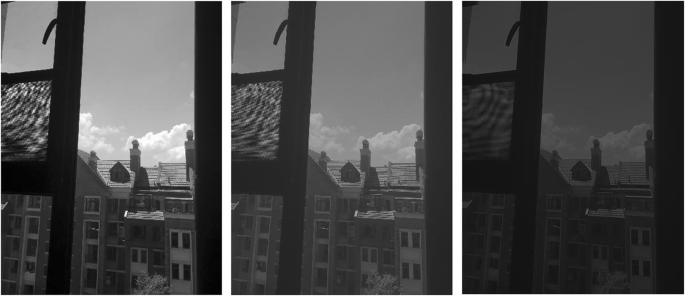
Image comparison before and after compression. (left is the original image, the middle is the first compression, the right is the second compression)
It can be seen from the results in Table 1 that after multiple compressions, the size of the image is significantly reduced and the image is getting smaller and smaller. The original image needs 2,764,800 bytes, which is reduced to 703,009 after a compression, which is reduced by 74.5%. After the second compression, only 182,161 is left, which is 74.1% lower. It can be seen that the wavelet transform can achieve image compression well.
5 Conclusion
With the development of informatization, today’s era is an era full of information. As the visual basis of human perception of the world, image is an important means for humans to obtain information, express information, and transmit information. Digital image processing, that is, processing images with a computer, has a long history of development. Digital image processing technology originated in the 1920s, when a photo was transmitted from London, England to New York, via a submarine cable, using digital compression technology. First of all, digital image processing technology can help people understand the world more objectively and accurately. The human visual system can help humans get more than 3/4 of the information from the outside world, and images and graphics are the carriers of all visual information, despite the identification of the human eye. It is very powerful and can recognize thousands of colors, but in many cases, the image is blurred or even invisible to the human eye. Image enhancement technology can make the blurred or even invisible image clear and bright. There are also some relevant research results on this aspect of research, which proves that relevant research is feasible [26, 27].
It is precisely because of the importance of image processing technology that many researchers have begun research on image processing technology and achieved fruitful results. However, with the deepening of image processing technology research, today’s research has a tendency to develop in depth, and this depth is an in-depth aspect of image processing technology. However, the application of image processing technology is a system engineering. In addition to the deep requirements, there are also systematic requirements. Therefore, if the unified model research on multiple aspects of image application will undoubtedly promote the application of image processing technology. Wavelet transform has been successfully applied in many fields of image processing technology. Therefore, this paper uses wavelet transform as a method to establish a unified model based on wavelet transform. Simulation research is carried out by filtering, watermark hiding, encryption and decryption, and image compression of image processing technology. The results show that the model has achieved good results.
Abbreviations
- CA:
-
Cellular automata
- CGH:
-
Computer generated hologram
- DCT:
-
Discrete cosine transform
- EPWIC:
-
Embedded Prediction Wavelet Image Coder
- HVS:
-
Human visual system
- LSB:
-
Least significant bits
- VOD:
-
Video on demand
- WT:
-
Wavelet transform
References
H.W. Zhang, The research and implementation of image Denoising method based on Matlab[J]. Journal of Daqing Normal University 36(3), 1-4 (2016)
J.H. Hou, J.W. Tian, J. Liu, Analysis of the errors in locally adaptive wavelet domain wiener filter and image Denoising[J]. Acta Photonica Sinica 36(1), 188–191 (2007)
M. Lebrun, An analysis and implementation of the BM3D image Denoising method[J]. Image Processing on Line 2(25), 175–213 (2012)
A. Fathi, A.R. Naghsh-Nilchi, Efficient image Denoising method based on a new adaptive wavelet packet thresholding function[J]. IEEE transactions on image processing a publication of the IEEE signal processing. Society 21(9), 3981 (2012)
X. Zhang, X. Feng, W. Wang, et al., Gradient-based wiener filter for image denoising [J]. Comput. Electr. Eng. 39(3), 934–944 (2013)
T. Chen, K.K. Ma, L.H. Chen, Tri-state median filter for image denoising.[J]. IEEE Transactions on Image Processing A Publication of the IEEE Signal Processing Society 8(12), 1834 (1999)
S.M.M. Rahman, M.K. Hasan, Wavelet-domain iterative center weighted median filter for image denoising[J]. Signal Process. 83(5), 1001–1012 (2003)
H.L. Eng, K.K. Ma, Noise adaptive soft-switching median filter for image denoising[C]// IEEE International Conference on Acoustics, Speech, and Signal Processing, 2000. ICASSP '00. Proceedings. IEEE 4, 2175–2178 (2000)
S.G. Chang, B. Yu, M. Vetterli, Adaptive wavelet thresholding for image denoising and compression[J]. IEEE transactions on image processing a publication of the IEEE signal processing. Society 9(9), 1532 (2000)
M. Kivanc Mihcak, I. Kozintsev, K. Ramchandran, et al., Low-complexity image Denoising based on statistical modeling of wavelet Coecients[J]. IEEE Signal Processing Letters 6(12), 300–303 (1999)
J.H. Wu, F.Z. Lin, Image authentication based on digital watermarking[J]. Chinese Journal of Computers 9, 1153–1161 (2004)
A. Wakatani, Digital watermarking for ROI medical images by using compressed signature image[C]// Hawaii international conference on system sciences. IEEE (2002), pp. 2043–2048
A.H. Paquet, R.K. Ward, I. Pitas, Wavelet packets-based digital watermarking for image verification and authentication [J]. Signal Process. 83(10), 2117–2132 (2003)
Z. Wen, L.I. Taoshen, Z. Zhang, An image encryption technology based on chaotic sequences[J]. Comput. Eng. 31(10), 130–132 (2005)
Y.Y. Wang, Y.R. Wang, Y. Wang, et al., Optical image encryption based on binary Fourier transform computer-generated hologram and pixel scrambling technology[J]. Optics & Lasers in Engineering 45(7), 761–765 (2007)
X.Y. Zhang, C. Wang, S.M. Li, et al., Image encryption technology on two-dimensional cellular automata[J]. Journal of Optoelectronics Laser 19(2), 242–245 (2008)
A.S. Lewis, G. Knowles, Image compression using the 2-D wavelet transform[J]. IEEE Trans. Image Process. 1(2), 244–250 (2002)
R.A. Devore, B. Jawerth, B.J. Lucier, Image compression through wavelet transform coding[J]. IEEE Trans.inf.theory 38(2), 719–746 (1992)
R.W. Buccigrossi, E.P. Simoncelli, Image compression via joint statistical characterization in the wavelet domain[J]. IEEE transactions on image processing a publication of the IEEE signal processing. Society 8(12), 1688–1701 (1999)
A.A. Cruzroa, J.E. Arevalo Ovalle, A. Madabhushi, et al., A deep learning architecture for image representation, visual interpretability and automated basal-cell carcinoma cancer detection. Med Image Comput Comput Assist Interv. 16, 403–410 (2013)
S.P. Mohanty, D.P. Hughes, M. Salathé, Using deep learning for image-based plant disease detection[J]. Front. Plant Sci. 7, 1419 (2016)
B. Sahiner, H. Chan, D. Wei, et al., Image feature selection by a genetic algorithm: application to classification of mass and normal breast tissue[J]. Med. Phys. 23(10), 1671 (1996)
B. Bhanu, S. Lee, J. Ming, Adaptive image segmentation using a genetic algorithm[J]. IEEE Transactions on Systems Man & Cybernetics 25(12), 1543–1567 (2002)
Y. Egusa, H. Akahori, A. Morimura, et al., An application of fuzzy set theory for an electronic video camera image stabilizer[J]. IEEE Trans. Fuzzy Syst. 3(3), 351–356 (1995)
K. Hasikin, N.A.M. Isa, Enhancement of the low contrast image using fuzzy set theory[C]// Uksim, international conference on computer modelling and simulation. IEEE (2012), pp. 371–376
P. Yang, Q. Li, Wavelet transform-based feature extraction for ultrasonic flaw signal classification. Neural Comput. & Applic. 24(3–4), 817–826 (2014)
R.K. Lama, M.-R. Choi, G.-R. Kwon, Image interpolation for high-resolution display based on the complex dual-tree wavelet transform and hidden Markov model. Multimedia Tools Appl. 75(23), 16487–16498 (2016)
Acknowledgements
The authors thank the editor and anonymous reviewers for their helpful comments and valuable suggestions.
Funding
This work was supported by
-
1.
Shandong social science planning research project in 2018
Topic: The Application of Shandong Folk Culture in Animation in The View of Digital Media (No. 18CCYJ14).
-
2.
Shandong education science 12th five-year plan 2015
Topic: Innovative Research on Stop-motion Animation in The Digital Media Age (No. YB15068).
-
3.
Shandong education science 13th five-year plan 2016–2017
Approval of “Ports and Arts Education Special Fund”: BCA2017017.
Topic: Reform of Teaching Methods of Hand Drawn Presentation Techniques (No. BCA2017017).
-
4.
National Research Youth Project of state ethnic affairs commission in 2018
Topic: Protection and Development of Villages with Ethnic Characteristics Under the Background of Rural Revitalization Strategy (No. 2018-GMC-020).
Availability of data and materials
Authors can provide the data.
About the authors
Zaozhuang University, No. 1 Beian Road., Shizhong District, Zaozhuang City, Shandong, P.R. China.
Lina, Zhang was born in Jining, Shandong, P.R. China, in 1983. She received a Master degree from Bohai University, P.R. China. Now she works in School of Media, Zaozhuang University, P.R. China. Her research interests include animation and Digital media art.
Lijuan, Zhang was born in Jining, Shandong, P.R. China, in 1983. She received a Master degree from Jingdezhen Ceramic Institute, P.R. China. Now she works in School of Fine Arts and Design, Zaozhuang University, P.R. China. Her research interests include Interior design and Digital media art.
Liduo, Zhang was born in Zaozhuang, Shandong, P.R. China, in 1982. He received a Master degree from Monash University, Australia. Now he works in School of economics and management, Zaozhuang University. His research interests include Internet finance and digital media.
Author information
Authors and Affiliations
Contributions
All authors take part in the discussion of the work described in this paper. The author LZ wrote the first version of the paper. The author LZ and LZ did part experiments of the paper, LZ revised the paper in different version of the paper, respectively. All authors read and approved the final manuscript.
Corresponding author
Ethics declarations
Competing interests
The authors declare that they have no competing interests.
Publisher’s Note
Springer Nature remains neutral with regard to jurisdictional claims in published maps and institutional affiliations.
Rights and permissions
Open Access This article is distributed under the terms of the Creative Commons Attribution 4.0 International License (http://creativecommons.org/licenses/by/4.0/), which permits unrestricted use, distribution, and reproduction in any medium, provided you give appropriate credit to the original author(s) and the source, provide a link to the Creative Commons license, and indicate if changes were made.
About this article

Cite this article
Zhang, L., Zhang, L. & Zhang, L. Application research of digital media image processing technology based on wavelet transform. J Image Video Proc. 2018, 138 (2018). https://doi.org/10.1186/s13640-018-0383-6
Received:
Accepted:
Published:
DOI: https://doi.org/10.1186/s13640-018-0383-6