- Research
- Open access
- Published:
Photo-id of blue whale by means of the dorsal fin using clustering algorithms and color local complexity estimation for mobile devices
EURASIP Journal on Image and Video Processing volume 2017, Article number: 6 (2017)
Abstract
We present an automatic program of blue whale photo-identification for mobile devices. The proposed technique works in the wavelet domain to reduce the image size and the processing time of the proposed algorithm, and with an edge enhancement filter, the characteristics of the blue whale are preserved. Additionally, an image palette reduction algorithm based on local image complexity estimation is introduced to eliminate redundant colors, thus decreasing the number of pixels that are bad classified in the segmentation process and minimizing the resource consumption of the mobile device. The segmented image is obtained with the FCM (fuzzy C-means) or K-means algorithms incorporating a dynamic filtering which is proposed in this paper to improve the brightness and contrast of the acquired image increasing the performance of the image segmentation. Experimental results show that the proposed approach potentially could provide a real-time solution to photo-id of blue whale images and it can be transportable and portable power for mobile devices. Finally, the proposed methodology is simple, efficient, and feasible for photo-id applications in mobile devices.
1 Introduction
The recognition of individuals is the main objective in many population studies on behavior, ecology, and biology allowing to estimate its population parameters through capture-recapture models and to produce models of its social structure [1]. Artificial marking is a unique identification mechanism (i.e., metal clips, tattoos) for individuals of a specific species, but this method is not very reliable because the animals can be moved or lose their markings [2, 3]. To address some of these problems, the individual identification of animals by their natural markings has become an important tool for the study of some populations of animals and has been applied to an equally wide range of animals such as whales, manta rays, and frogs [4].
One of the most popular visual identification of natural markings of an animal is the photo-identification (photo-id) technique. This way of making visual identification of an individual allows photo storage repository for generating photograph capture-history records of individuals [4]. These repositories can be examined manually and visually to develop a single set of classes and sub-classes; however, as the number of images in the collection of the repository increases beyond a person’s ability to process visual characteristics of the candidate to see whether or not coincide with a new photograph by hand-eye, the development of techniques more fast and automated to compare the new photographs obtained above is required [5]. The widely use photo-id technique to identify wild species individuals employs natural markings such as pigmentation patterns, the spot patterns in the fur of cheetahs [6] or morphology and distribution of these spots in the red pandas [7], the fin shape of the cetaceans or nick and notches in the dolphin’s fin [5, 8], or other features such as scars also they can be identified [9]. This non-invasive technique uses images acquired from a determinate distance to obtain the natural markings to be identified and classified with the least disturbance possible [9]. The photo-id technique has long been used to identify large whales and was first used by researchers in the 1970s, by recognizing the pigmentation patterns of the ventral side of the caudal fin in humpback whales [10]. Traditional methods of matching photographs of ventral fluke surfaces require manual pairwise comparison of all images within and among data sets, which are often very large. This process requires substantial time, effort, and expertise. Furthermore, as each of the data sets grows, the number of comparisons required increases exponentially. The system performs the comparison of new images taken in the field to identify brands and caudal fins of the whale. From this, implementation has been speeding up the photo-id of some marine animals [5, 8–10]. The search of natural patterns by visual comparison of hundreds of images to find an individual identity is susceptible to errors [8, 11]. This is because the photo-id is performed by manual segmentation by a person whose result could be false positive or false negative in the identification and classification of a determined individual. For this reason, it begins with the designers of an “economic” system software and hardware for the blue whale photo-id.
The identification of individual blue whales is still done manually by comparing new photographs with a catalog of known individuals. This process is tedious and laborious dedicating additional resources (human-consumption hours) to recognize the individual. To perform this task, a new method using the natural shape of the dorsal fin in seven different types (Fig. 1) coupled with different pigmentation colorations of the flanks was designed [12]. A further category includes undefined dorsal fins for photographs in which the angle may bias the dorsal fin classification. In these cases, the photographs are temporally classified as undefined, until a better photograph of this particular individual is obtained. A new focal animal survey applied to blue whale (Gendron, unpublished data) requires individual identification of the focal animal at sea. Because time is an important variable at sea and positive identification in the focal individual follow-up is critical (i.e., knowing if the individual is a female, male, or juvenile), and space and computer workable area is often limited for equipment for the photo-id, a new program for photo-id is lacking. Today, a variety of computer systems for photo-id of the animals are based on unique characteristics of each species. In these systems, each new image requires previous manual preprocessing (i.e., cutting, improve brightness and contrast of the image) resulting in the best contrast contour of the blue whale but this also increases the processing time, subjectivity, and error in the segmentation results. The principal problem to be confronted is in isolating the object of study.

Different types of dorsal fin [12]: a triangular with straight edges; b triangular falcate and curved smoothly backward; c straight pointing up; d marked, different size and shape but showing obvious scare; e falcate curved backward; f hooked, large size, and highly curved backward; g mutilated, loss large portions, or completely mutilated; and h indefinite, not categorized
The segmentation process in a computer vision system is no trivial problem because the blue whale’s images are acquired in their natural habitat, with the color and shape of blue whales melted with the background image (i.e., the color skin of the blue whale with the color of an ocean and/or sky). For the use of standard cameras or mobile devices that provide a low contrast, the angle variations in the photos, the distance between the objects and camera, the light (the environment conditions), and the shadows are conditions that do not provide an optimal segmentation. To overcome these drawbacks, various computer-aided identification systems have been developed to recognize the dorsal fin of a cetacean or the forms and contours in other marine mammals [8, 12]. In this paper, the proposed computer-aided identification system for the blue whale images is tested with the blue whale photographic catalog obtained in the southwestern Gulf of California, Mexico, and was provided by the researchers of CICIMAR-IPN (Interdisciplinary Center of Marine Sciences-National Polytechnic Institute of Mexico). The process of photo-id allows an easy access for biologists and other researchers in their field of study of blue whales using a mobile device as a portable computer system. It is important to mention that the use of mobile device assures a real-time process of photo-id in the same place where the image was acquired providing the follow-up of blue whales without the use of a standard camera and ensures the image processing technique off line or the use of cloud computing because the internet services are not available in this remote area.
The proposed technique uses the wavelet domain and an edge enhancement filter to preserve the fine details of the blue whale’s dorsal fin image reducing the image size and the processing time of the proposed algorithm [13]. Additionally, an image palette reduction algorithm is introduced to eliminate redundant colors in the image; this reduction is based on local image complexity estimation which employed the median algorithm and the standard deviation [13]. This reduction improves the segmentation process decreasing the number of pixels that are bad classified and minimizing the resources consumption of the mobile devices. The segmented image is obtained with the K-means [14] or the FCM (fuzzy C-means) [15] algorithms incorporating a dynamic histogram filtering which it improves the brightness and contrast of the image acquired by the mobile device increasing the performance of the image segmentation. The low cost of proposed system represents a reliable real-time solution for blue whale photo-id that reduces the payload or devices needed to perform this task. Finally, this technique is simple, efficient, and feasible for applications in mobile (Smartphones and tablets) devices.
The rest of this paper is organized as follows. In Section 2, the proposed algorithms are presented. Section 3 shows the performance results of proposed methods. The discussions of results and other methods used as comparative are presented in Section 4, and we draw our conclusions in Section 5.
2 Materials and methods
The segmentation of blue whale’s images is described in five stages (see Fig. 2). The first stage involves the acquisition of the RGB images via different standard cameras and mobile devices. In the second stage, a band-pass filter in the wavelet domain is used to improve the edges and contours of the blue whale, and reducing the image size ensuring that the processing time of methodology is decreased, it is realized in each channel (R, G, and B) of the original image [13, 16]. In the third stage, a color palette reduction method is introduced to remove redundant colors contained in the image channels (reducing the storage and memory requirements); the quantization of each pixel is determined using the median algorithm and a threshold based on the standard deviation of the local complexity of the image [13]. In the fourth stage, a dynamic histogram filtering is proposed to improve the brightness and contrast of the images; it is combined with the standard FCM and/or K-means clustering algorithms to provide more robustness in the segmentation process. Finally, in the fifth stage, the processed R, G, and B channels are combined in a single component to obtain the final segmentation.

Block diagram of proposed method
-
Stage 1: image database
To test the proposed methodology, we use the CICIMAR-IPN image blue whale database in JPG format. This database is not public, and it can be obtained with permission of CICIMAR [12, Gendron, unpublished data]. These images were acquired in their natural habitat (uncontrolled environment) using different mobile devices. We also use images acquired with the standard camera Canon EOS reflex [12] as comparative when the proposed algorithms were running to provide that the working conditions and the quality of the acquired images by mobile devices are not constraints in the applicability of the proposed system. Figure 3 depicts some RGB blue whale images acquired by the cameras of the mobile devices Sony Xperia J with 5 M pixel camera with LED flash and auto focus, Sony Xperia T2 with 13 MP camera with video recording HD (1080p), and Samsung Galaxy S4 with rear camera CMOS with 13 MP and frontal camera with 2 MP, power led flash autofocus, and the standard camera Canon EOS reflex 5 mm with a 70-300tele-objective lens.
Fig. 3 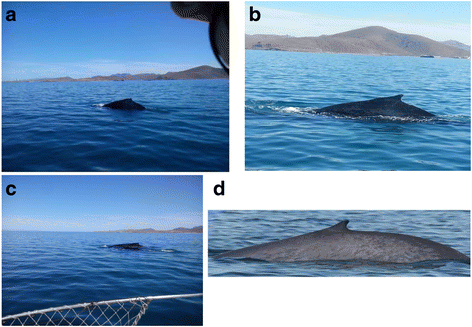
Images from the CICIMAR-IPN database. a Image acquired by mobile device Sony Xperia J. b Image acquired by mobile device Sony Xperia T2. c Image acquired by mobile device Samsung Galaxy S4. d Image acquired by a standard Cannon camera
From the RGB color image, we separate its color components (R, G, B) and we apply in each component the next stages of the proposed method. We also mention that in the case of the use of a gray-scale image obtained from the RGB image, the histogram results indicated that there are not many differences between the intensities that compose the objects (i.e., the sea, the sky, and the edge of the blue whale) into the gray-scale image making more difficult the segmentation process. For this reason, we choose to work with the channels of the RGB image where each channel can give further information relating to objects and/or characteristics of the blue whale in the image in order to discriminate objects and/or edges outside the blue whale.
-
Stage 2: preprocessing
A preprocessing stage is proposed to improve and/or remove some characteristics in the acquired images related to the dorsal fin detection; some of these characteristics are the following: (a) posture: the characteristics of the blue whales in the acquired images in real environments can vary due to the disposal (frontal, profile, etc.) of the blue whale, which can lead to occlusion of the characteristics of blue whales such as dorsal fin and pigmentation skin; (b) structural components: the sea, sky, and other objects in the scene may vary in shape, size, and color; (c) location: the acquired images are highly affected by the location of the blue whale in the image; (d) occlusion: in a real environment, the blue whale could be partially or fully occluded by other moving objects; and (e) environmental conditions: an image is highly dependent on environmental conditions such as weather conditions and light intensity.
In this stage, the Discrete Wavelet Transform (DWT) is used to describe the texture in the blue whale image because it provides a multi-resolution (MRA) analysis and its space-frequency properties exhibit good precision for texture analysis and classification providing edges and fine detail preservation in the image [13, 16]. The DWT subdivides an image into several frequency bands known as LL—horizontal low pass and vertical low pass, LH—horizontal low pass and vertical high pass, HL—horizontal high pass and vertical low pass, and HH—horizontal high pass and vertical high pass [13].
The circular Haar wavelet (CHW) is used in the wavelet analysis due to its compactness and energy conservation characteristics of the original image; it is simple and easy to be performed in feature extraction applications [16]. The CHW can be divided into two types: the type of edge extraction can be calculated using the 1D Haar wavelet and the type of corner extraction can be performed with the 2D Haar wavelet. The edge extraction of the CHW can be seen as a band-pass filter [16]. In this stage, the 1D Haar DWT is applied to provide edge enhancement, and then, the 2D Haar DWT is employed to improve the contour of blue whale in the original image.
The processed images are obtained from the LL sub-band during the wavelet decomposition. The LL sub-band image represents a low scale of the original image permitting that the process time of proposed segmentation algorithm decreases significantly. To illustrate this stage, the processed R, G, and B channels are combined to show the final edge enhancement RGB image. For convenience, Fig. 4 shows the negative of the edge enhancement images to demonstrate that the proposed method can improve the characteristics of the dorsal fin and pigmentation skin (intensity pixels) of the blue whale; the sea, sky and other objects are also improved but their intensity changes can be distinguish between the intensities of the blue whale’s body and the other objects to provide a better image segmentation. This can be appreciated by comparing the negative images of original and processed images.
Fig. 4 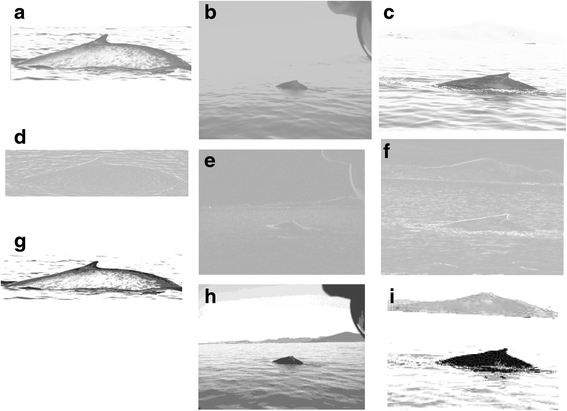
Visual results obtained in stages 2 and 3. a–c Original RGB images. d–f Enhanced RGB images obtained in the preprocessing stage. g–i Quantized RGB images obtained in the color palette reduction stage. For convenience, these images are presented as negative images
After the edge enhancement of the blue whale body, an object detection method is used to find the points (pixels) that define the contour of the dorsal fin in the images for the classification of blue whale by means of the dorsal fin. The object detection techniques can be divided into two major categories: techniques based on characteristics and image-based techniques [17]. Techniques based on characteristics make explicit the use of facial features. The apparent (visual) blue whale properties, such as color of the skin and the dorsal fin geometry, can be used during the blue whale detection. In our case, standard operators of translation and/or rotation are employed to enhance the points (pixels) that define the contour of the dorsal fin in the images.
-
Stage 3: color palette reduction
The color quantization of an image is a process that uses a limited number of colors to represent an image; it is widely used in image segmentation, image retrieval, and image compression [17]. The objective is to approximate as closely as possible the original full-color images. This technique is necessary for systems that can display only a few colors. For example, systems with 8 bits/pixel frame buffers can display only 256 colors. Although various modern systems have 24 bits/pixel frame buffers and can display 224 = 16,777,216 colors, color quantization is still practical for system running animations and those used for advanced graphics applications. It reduces storage requirements and saves image transmission time over networks [17].
The proposed technique is used to adjust the number of colors according with the visual image content (in our case, the blue whale’s contour and the background) to minimize the resource consumption of the mobile devices when the algorithms are running and in the case of the requirements of load and storage of the original and processed images, decreasing the bandwidth in data transmission networks [17]. This reduction also improves the segmentation process decreasing the number of pixels that are bad classified in the clustering part (false classification).
The proposed quantization technique is based on local image complexity estimation employing the median algorithm and the standard deviation [13]. Using the sub-images (R, G, and B) of the LL sub-bands obtained in the preprocessing stage, the standard deviation for each channel is computed using a 3 × 3 kernel [13],
$$ {\sigma}_c=\sqrt{\frac{1}{n}{\displaystyle \sum_{i=1}^n{\left({x}_i-\overline{x}\right)}^2}} $$(1)where x i is the value of the ith element in the current kernel, \( \overline{x}=\frac{1}{n}{\displaystyle \sum_{i=1}^n{x}_i} \) is the mean value of the current kernel, and n = 9 is the number of elements in the sample.
The criterion used to reduce the color palette is applied in each 3 × 3 kernel to obtain the quantized color image in the following way,
$$ quantized=\left\{\begin{array}{ll}{x}_{med},\hfill & {\sigma}_{x_c}<T\hfill \\ {}{x}_c,\hfill & otherwise\hfill \end{array}\right. $$(2)where quantized is the quantized kernel, x med is the median of the pixels contained in the kernel, x c is the central pixel in the kernel, \( {\sigma}_{x_c} \) is the standard deviation of the central pixel x c , T = σ c w f is the threshold used to fix the pixels whose values are considered to quantize the color palette, and w f = 3 is a weight factor given for the number of components of the RGB image. The median algorithm is proposed to homogenize the intensity of central pixel x c with its neighbors in the current kernel to obtain the quantized color image. The 3 × 3 kernel size is proposed according to the best quantization results.
The proposed color quantization method is carried out in several iterations, the stopping criterion is \( \sqrt{{\left({x}_c-{x_q}_c\right)}^2}=0 \), where x qc is the central quantized pixel in the kernel. The image quantization is realized up to the subtraction between the current pixel and quantized pixel which is zero; in our case, the number of quantized levels is 16.
Figure 4g–i shows the quantized RGB images (as negative images) obtained in this stage. Comparing the processed (quantized) images (Fig. 4g–i) with the previous results of Fig. 4, we observe that the proposed color palette reduction method can limit the number of intensities to represent the images as closely as possible to the original images, reducing the storage and memory requirements and providing a better segmentation process avoids the false classification of pixels. For the channel R, in the case of the Fig. 4g, the reduction obtained is of 2 kb compared with the original size of 40 kb of Fig. 4a, and h is limited to 4 kb from the original size of 48 kb of Fig. 4b; this represents a reduction between 90 and 91.66% in the storage and memory requirements that potentially could provide a real-time solution to save image transmission time over networks. Also, the quality of quantized images is of 22.04, 30.45, and 27.89 dB by means of the use of PSNR (Peak Signal to Noise Ratio) between the images of Fig. 4d–f, g–i. The PSNR values demonstrate that the proposed quantization technique provides an optimal quality in the processed images in the case of our application, where the quantized images appear to have a good subjective quality. Finally, the use of mobile devices instead of laptops or other computer systems provides the portability needed in real-time applications, charge consumption, and easy handling in confined places such as little boats.
-
Stage 4: adaptive segmentation algorithm
Image segmentation is one of the most important research topics in image analysis and computer vision; it refers to the process of subdividing an image into connected regions where the pixels of a region (cluster) share a common property.
The acquired images from the CICIMAR-IPN database have different brightness and contrast parameters between them, so that each one presents different spatial and frequency characteristics. When the standard FCM [15, 18] and K-means [14] algorithms are applied to segment an image in two data regions (blue whales and background), several pixels are incorrect classified providing an incorrect segmentation and increasing the computational complexity of these algorithms.
For these reasons, we propose the Dynamic Histogram filtering FCM (DHFCM) that takes in account the variations in the frequency histogram of the brightness and contrast in the images to provide more robustness in the segmentation process.
The standard FCM is defined as follows [15, 18]. Let X = {x 1, …, x n } be the set of given feature data (in our case, the RGB pixel intensities of blue whale) and let c the number of clusters (1<c<n) represented by the fuzzy set C j (j = 1, …,c). Then, we call U f = (u ij ) a fuzzy cluster partition of X if \( {\displaystyle {\sum}_{i=1}^n{u}_{ij}>0} \) and ∀j ∈ {1, …,c} and \( {\displaystyle {\sum}_{j=1}^c{u}_{ij}=1} \) and ∀i ∈ {1, …,n} hold. A fuzzy cluster model of a given data set X into c clusters is defined to be optimal when it minimizes the objective function (3) under the above two constraints,
$$ {J}_f\left(X;{U}_f,C\right)={\displaystyle \sum_{i=1}^n{\displaystyle \sum_{j=1}^c{u}_{ij}^m{\left\Vert {x}_i-{c}_j\right\Vert}^2}} $$(3)where the parameter m > 1 is a weighting exponent called the fuzzifier and ‖x i − c j ‖2 is the square of the Euclidean distance from feature vector x i to the center of the class c j . The objective function J f is alternately optimized using the parameters u ij and c j (membership degrees and the cluster centers) by setting the derivative of J f with respect to the parameters equal to zero (taking into account the established constraint above). The resulting equations for the two iterative steps forming the FCM algorithm are given as follows,
$$ {u}_{ij}=\frac{{\left\Vert {x}_i-{c}_j\right\Vert}^{-\frac{2}{m-1}}}{{\displaystyle {\sum}_{k=1}^c{\left\Vert {x}_i-{c}_k\right\Vert}^{-\frac{2}{m-1}}}} $$(4)$$ {c}_j=\frac{{\displaystyle {\sum}_{i=1}^n{u}_{ij}^m{x}_i}}{{\displaystyle {\sum}_{i=1}^n{u}_{ij}^m}} $$(5)The objective function of the standard FCM algorithm (3) does not take into account any spatial information making the FCM to be very sensitive to artifacts and noise. For this reason, we incorporate the neighborhood information of brightness and contrast into the clustering algorithm during the classification process by using a proposal named Dynamic Histogram (DH) method. This algorithm improves the brightness and contrast in the images with different characteristics showing an unvarying Gaussian distribution of the histogram,
$$ \mathrm{D}\mathrm{H}={\theta}_{DH}=\left\{\begin{array}{l}{\overline{x}}_d,\kern1em {x}_i\le {\overline{x}}_d\kern0.5em \mathrm{and}\kern0.5em {\mathrm{cov}}_{XY}<0\\ {}{x}_i,\kern1em \mathrm{otherwise}\end{array}\right. $$(6)where \( {\overline{x}}_d=\frac{1}{n}{\displaystyle \sum_{i=1}^n{x}_i} \) is the mean value in a 3 × 1 sliding window, \( {\operatorname{cov}}_{XY}=\frac{1}{n}{\displaystyle \sum_{i-1}^n\Big({x}_i}-\overline{x}\Big)\left({y}_i-\overline{y}\right) \) is the covariance, x i represents the i-element of the sliding window, y i represents the current element in the histogram, \( \overline{y} \) represents the mean value of the histogram, and n = 3.
The mean and covariance values show a linear dependence of the intensity values in the sliding window using this criterion (6). So, the high brightness and contrast values found in the images are changed by consistent values according to the distribution of the DH. For this reason, we could say that the proposed DH algorithm eliminates the impulsive noise caused by high-contrast lighting values in the acquired images.
Then, we can use the proposed DH as an estimator of the brightness and contrast of the pixels of standard FCM algorithm to improve the segmentation process due to different structural components and environmental conditions presented in the images. With this base, we can define the new objective function to be minimized in the proposed DHFCM as,
$$ {J}_g\left({\varTheta}_{\mathrm{DH}};{U}_f,C\right)={\displaystyle \sum_{i=1}^n{\displaystyle \sum_{j=1}^c{u}_{ij}^m{\left\Vert {\theta}_{\mathrm{DH}}-{c}_j\right\Vert}^2}} $$(7)where Θ DH = {θ DH|1, …, n} is a vector with the DH estimator applied on the intensity feature vector of image.
Since the gradient of J g with respect to u ij and c j vanishes when reaching the local optimum and taking into account the conditions to minimize the objective function, it is easy to show that the optimal updating equations of U f and C are given by,
$$ {u}_{qj}=\frac{{\left\Vert {\theta}_{\mathrm{DH}}-{c}_j\right\Vert}^{-\frac{2}{m-1}}}{{\displaystyle {\sum}_{l=1}^c{\left\Vert {\theta}_{\mathrm{DH}}-{c}_l\right\Vert}^{-\frac{2}{m-1}}}} $$(8)$$ {c}_j=\frac{{\displaystyle {\sum}_{i=1}^n{u}_{ij}^m{\theta}_{\mathrm{DH}}}}{{\displaystyle {\sum}_{i=1}^n{u}_{ij}^m}} $$(9)The parameters for the proposed DHFCM algorithm are set to m = 2 and ε = 1e−4 in the clustering part (initialized randomly). We found the optimum parameter for the maximum number of iterations T = 20; it is obtained from an average of iterations for different segmented images to determine the best value closes to the threshold ε = 1e−4. The number of clusters c depends in the image to be segmented, but in our case, it is set to 2 (blue whales and background). Finally, the proposed segmentation method uses only constants making the method to be simple, efficient, and feasible for this proposed application.
In order to decrease the number of pixels that are bad classified in the clustering part (segmentation stage), we propose to use the proposed DH method with the standard K-means clustering algorithm. The new method is called as Dynamic Histogram K-means (DHKM). The theoretical basis of the K-means can be found in [14]. Finally, Fig. 5 presents the segmentation results in the channel R (Fig. 5a–c) using the standard KM, the standard FCM, and the proposed DHFCM, where one can see that the proposed method appears to have better subjective quality in comparison with the standard methods.
Fig. 5 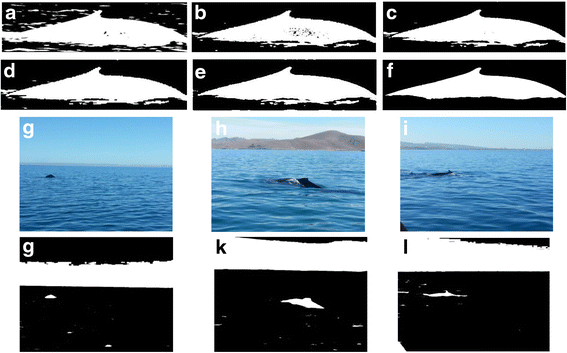
Visual segmentation results. Segmented images of channel R obtained from the quantization stage (see Fig. 4g–i). a Segmented image with the standard KM algorithm. b Segmented image with the standard FCM algorithm. c Segmented image with the proposed DHFCM algorithm. Segmented images (binary image): d segmented image with the standard KM, e segmented results with the standard FCM, and f segmented image with the proposed DHFCM algorithm. Results in other images obtained by mobile devices: g, h images acquired by Sony Xperia J, i image acquired by SonyXperiaT2, and j–l segmented images with the proposed DHFCM algorithm
-
Stage 5: minimize the number of pixels that are bad classified.
From an RGB image, the resulted segmentations of the independent R, G, and B channels could have different pixels whose values are incorrect classified in other cluster providing incorrect segmentations between the three channels. For this reason, we combine the segmented images of the three components to have the final segmented image with a single gray-scale component avoiding as closely as possible the bad classification of pixels in the following way,
$$ final\ segmented\kern0.5em image=\frac{R+G+B}{3} $$(10)where R, G, and B are the segmentations obtained in the images of the channels R, G, and B, respectively.
The following criterion is applied to obtain a final binary segmented image with only two clusters (black for the background and white for the blue whale),
$$ binary\ image=\left\{\begin{array}{ll}1,\hfill & final\ segmented\kern0.5em image<{\sigma}_c\hfill \\ {}0,\hfill & otherwise\hfill \end{array}\right. $$(11)where final segmented image is obtained from (10) and σ c is the standard deviation computed in a 3 × 3 sliding window (Eq. (1)).
Figure 5d–f shows the binary image that represents the final segmentation of the standard KM, the standard FCM, and the proposed DHFCM segmentation algorithm, respectively. From this Figure, one can see that the proposed algorithm (see Fig. 5f) shows the better subjective quality in comparison with the standard methods. We observe that the bad classification of pixels in the Fig. 5c is corrected in this stage providing a good classification of blue whales and background. Finally, with the results of binary image, we can obtain the contour, edges, and characteristics of the blue whale and its dorsal fin in the original image to use this data in the classification process.


3 Results
The CICIMAR-IPN photographic catalog contains 771 images in digital RGB color image format which 621 images were acquired with the Canon camera and 150 images where obtained with different mobile devices. In this catalog, the 57.2% of images correspond to both sides of blue whale, and the 23.8 and 19.0% belong to the right and left side of blue whale, respectively. For the analysis, we only consider the segmentation and classification of blue whale images with the dorsal fin categorized as triangular, hooked, and falcate. The performance results of these proposed methods are compared with the manual segmentations of the first human observer as a ground truth. Also, a comparison of the second human observer with the ground truth images provides a performance measure that is regarded as an optimal performance level. The ground truth images were provided by CICIMAR-IPN.
The proposed DHFFCM and DHFKM algorithms are implemented on a tablet with a Dual Core processor, CPU speeds of 1.2 GHz, Android Jelly Bean OS 4.1, and 9 GB of memory, and the development software is an environment visual Android. Figure 6 shows the graphical user interface (GUI) used in the handling of the proposed application (App). This figure shows the main screen of the proposed App for a mobile device and the main menu to access the proposed App with different options (CAMERA for image acquisition, FILES to upload acquired or processed images, IMAGES to perform the image segmentation for photo-id, and EXIT to exit of the proposed App), and the segmentation of an image.

GUI of the proposed App. a Home screen. b Main menu. c Segmented image
During the tests, four classification cases are considered. The two classifications are the true positive (TP) and the false positive (FP), and two misclassifications are the false negative (FN) and true negative (TN). By using these metrics, we can obtain different performance measures such as reported in [19],
In our case, the specificity (Sp) is the ability to detect non-blue whale pixels, the sensitivity (Se) reflects the ability to detect the blue whale edge, the accuracy (Acc) is the probability that an identified blue whale pixel is a true positive, and the similarity (Si) compares the results of a segmented image with the ground truth image. We also calculate the entropy and the purity. The entropy is a measure to know the dispersion of a group with respect to an established class. Thus, if all clusters consist of objects with only a single class label, the entropy is 0. However, as the class labels of objects in a cluster become more varied, the entropy increases [20],
where j represents each cluster and p ij is the probability that a member of cluster j belongs to class i.
The purity quantifies the degree to which a cluster contains entities belonging to this fraction; it is defined as follows: the purity in each cluster j is computed as \( \mathrm{purity}=\frac{1}{n_j} \max \left({n}_j^i\right) \), where \( {n}_j^i \) is the number of objects in cluster j with class label i.
Tables 1, 2, and 3 show the performance results in the case of segmentation of triangular dorsal fin, hooked dorsal fin, and falcate dorsal fin in terms of similarity (Si), specificity (Sp), sensitivity (Se), accuracy (Acc), entropy (entropy), purity (purity), and the processing time (PT) in seconds used to compute the proposed algorithms. We also present the max, min, median, and standard deviation obtained with the proposed algorithms. From these tables, we observe that the performance results are due to the nature of the fin type and the environmental conditions when the images were acquired. We also mention that in Tables 1, 2, and 3, the images acquired with mobile devices are marked with an asterisk. Comparing the performance criteria obtained with the use of the proposed DHFCM and DHKM clustering algorithms, we found the following:
(a) The DHFCM improves the results obtained with the DHKM clustering algorithm in the most of cases (see Tables 1, 2, and 3). For example, the accuracies found in the classification of triangular fin are from 91.69 to 98.97 (DHFCM) and from 90.24 to 99.04 (DHKM); for the hooked fin classification are from 88.19 to 98.29 (DHFCM) and from 87.33 to 98.26 (DHKM); and for the falcate fin classification are from 89.61 to 97.56 (DHFCM) and from 88.02 to 98.05 (DHKM).
(b) In the case of average of similarity (Si) and computational cost (PT), we found in the classification of triangular fin (see Table 1) that the DHFCM (Si = 94.74% with PT = 13.5754 s) provides better results in comparison with the DHKM (Si = 94.50% with PT = 5.2040s); for the hooked fin classification (see Table 2), the DHFCM (Si = 93.50% with PT = 15.4775 s) improves the results of DHKM (Si = 93.28% with PT = 6.0702 s); finally, in the case of the falcate fin classification (see Table 3), the results of DHFCM (Si = 92.42% with PT = 14.8512 s) are worst than the results obtained with the DHKM (Si = 92.83% with PT = 5.0486 s). In other words, the Si performance changes in favor of the proposed method with DHFCM from −0.40 to 0.24% of Si but the PT varies in favor of DHKM from 8.3714 to 9.8026 s in comparison with DHFCM; it is the DHKM which provides a PT from 5.0486 to 6.0702 s demonstrating that the proposed method potentially could provide a real-time solution to photo-id (segment and classify) of blue whale images and it can be transportable and portable power for mobile devices such as Smartphones and tablets.
(c) Almost there are no differences in the performance of proposed methods between the processed images acquired by mobile devices and standard camera. In this case, the working conditions and the quality of the acquired images by mobile devices are not constraints in the applicability of the proposed method.
We also use the receiver operating characteristic (ROC) curves to illustrate the performance of a classifier by plotting the Se and Sp. The classifications of the accuracy of test are as follows: if the value of the area is between 0.5 and 0.7, then the accuracy is low; if it is between 0.7 and 0.9, the accuracy is average-high; and if the value is greater than 0.9, the accuracy of the test is high [21]. In Fig. 7, the experimental results from the proposed methods expressed in terms of ROC curves are presented. Figure 7a shows a high accuracy for the segmentation performance using the DHFCM and DHKM method. The best result is for the hooked fin with a value of 1, followed by the triangular and falcate fin with the values of 0.99 and 0.98, respectively. The ROC curve (Fig. 7b) shows a zoom histogram where the best performance is for the triangular and hooked fin with a value of 1 and 0.98 for the falcate fin. The total area under the ROC curve is a single index for measuring the performance of a test. The AUC results are obtained from the ROC curves. For the triangular dorsal fin, the AUC values are of 0.9750 and 0.9320 for the DHFCM and DHKM, respectively; in the case of hooked dorsal fin, the DHFCM and DHKM have AUC values of 0.9208 and 0.9180, respectively; finally, for the falcate dorsal fin, the AUC values are of 0.9043 and 0.9030 for the DHFCM and DHKM, respectively. From the AUC results, the DHFCM provides better results than DHKM. Also, we observe that the results for the triangular fin are better than the results obtained in other tests; this is subject to the level of abstraction for the person that is analyzing the results for a specific type of dorsal fin.

Performance ROC curve of proposed algorithm. a DHFCM and DHKM curve ROC for falcate fin, hooked fin, and triangular fin. b Zoom of the curve ROC (8a)
4 Discussions
We compare our proposal with two recent methods published in the literature that detect whales in images. A method to detect right whales using [22] implements a convolutional neural network for prediction, which requires up to 40,000 layers and achieves training to 68% accuracy. This method proposes the detection of the right whale through the image of the back of the whale taken from above. Another method known as DARWIN [23] performs detection of the dorsal fin with an accuracy of up to 84% accuracy; this method uses the threshold method using the histogram. The disadvantage of this technique is the amount of input data required by the neural network to train and classify the data.
These methods were not developed to detect individual whale but any type of whale species. The standard FCM algorithm is also used to verify the performance of the proposed App according to Tables 1, 2, and 3 and Fig. 5. For example, the use of standard FCM provides up to 70% of similarity with a processing time of 367.4680 s. In the segmentation result obtained from the standard FCM, certain sections belonging to the ocean are not remove completely, and some sections of the blue whale can be confused with the sea (background) causing a bad classification of the blue whale. The advantages of the proposed application are that it does not use special cameras to acquire the images, it does not compute more complex algorithms with high computation cost as reported in [22, 23], and it does not need a large amount of data to train and classify the processed images making that the proposed algorithms can be implemented in standard devices such as mobile devices, as it is demonstrated in Section 2. The proposed methods provide accuracies of 98.9790% for DHFCM and 99.0469% for DHKM in the case of triangular fin detection; for the hooked fin detection, the accuracies are of 95.49% for DHFCM and 95.30% for DHKM; and for falcate fin detection, the accuracies presented for DHFCM and DHKM are of 97.5681 and 98.0593%, respectively (see Tables 1, 2, and 3). The results presented here demonstrate that the present proposal is 31% higher for results in [22] and 15% for results in [23]. In [10], the results obtained by other methods’ precision photo-identification ranging from 55% accuracy in identifying pink dolphin and 97% accuracy in identifying sperm are discussed. For these cases, the proposed algorithm exceeds 40.30% in accuracy for Pink Dolphin and 2.046% for the sperm whale. The less computation cost of the proposed App makes it reliable for a real-time solution for the segmentation and classification (photo-id) of blue whales using a mobile device as a portable computer system. The photographic matches is conducted on site where the image is acquired, thus providing the individual blue whale information without the use of an image processing techniques on line or the use of cloud computing.
5 Conclusions
The algorithm proposed here includes two new methods of clustering DHFCM and DHKM; they use simple and easy techniques, as DWT and reducing the color palette that provides the robustness needed in the segmentation and classification of the dorsal fin to the photo-id. The theme of the image segmentation is a highly debated topic and remains an open issue because each image has different characteristics even taking the picture with the same device. That is why, the main contribution of this work is that each image of blue whales has different characteristics, because the angles of shooting and the incidence of light on the skin of the blue whale vary depending on the time shooting photograph and individual objects or animals that may be included in the scene which have high randomness. Therefore, the techniques proposed here help in the process of elimination of unexpected visual artifacts presented in the actual images of the blue whale. To measure the performance of the algorithm proposed here, different tests with different types of cameras were performed to verify the simplicity and portability of the system and validate the accuracies obtained in each test for each performed with different types of cameras (Cannon and cameras of the mobiles devices) were preserved with the best returns. The photo-identification system on mobile device is an alternative portability for researchers in the field to obtain a quick way to identify blue whales in their habitat; this system represents a double tool to assist the process of photo-identification as it can be run from a computer or of a mobile device. The new proposals DHFCM and DHKM due to its easy operation and preprocessing of the images obtained in the habitat of the blue whale are a feasible application for mobile devices, where some processes that run on mobile devices come to be limited by the equity of these, such as the battery and memory. Finally, the proposal App offers a real-time solution to the blue whale photo-identification using a mobile device such as a portable computer.
References
KA Walker, AW Trites, M Haulena, DM Weary, A review of the effects of different marking and tagging techniques on marine mammals. Wildl. res. 39, 15–30 (2012). http://dx.doi.org/10.1071/WR10177
RG Harcourt, E Turner, A Hall, JR Wass, M Hindell, Effects of capture stress on free-ranging, reproductively active male Weddell seals. J. comp. physiol. neuroethol. sens. neural. behav. physiol. 196, 147–154 (2010). doi:10.1007/s00359-009-0501-0
CJA Bradshaw, RJ Barker, LS David, Modeling tag loss in New Zealand fur seal pups. J. agric. biol. environ. stat. 5(4), 475–485 (2000). doi:10.2307/1400661
CW Speed, MG Meekan, CJA Bradshaw, Spot the match—wildlife photo-identification using information theory. Front. Zool. 4(2), 1–11 (2007). doi:10.1186/1742-9994-4-2
Whitehead H., Computer Assisted Individual Identification of Sperm Whale Flukes, ed. Hammond P. S., Mizroch S.A. and Donovan G.P., , 12, 71-78, (1990)
MJ Kelly, Computer-aided photograph matching in studies using individual identification: an example from Serengeti Cheetahs. J. mammal. 82(2), 440–449 (2001). doi:10.1644/1545-1542(2001)082<0440:CAPMIS>2.0
S Shrestha, KB Shah, D Bista, HS Baral, Photographic identification of individual red panda (Ailurus fulgens Cuvier, 1825). Appl. ecol. environ. sci. 3(1), 11–15 (2015). DOI: 10.12691/aees-3-1-3.9
GR Hillman, B Würsig, GA Gailey, N Kehtarnavaz, A Drobyshevsky, BN Araabi, HD Tagare, Computer-assisted photo-identification of individual marine vertebrates: a multi-species system. Aquat. mammal. j. 29(1), 117–123 (2003). doi:10.1578/016754203101023960
J Alessi, M Aïssi, C Fiori, Photo-identification of sperm whales in the north-western Mediterranean Sea: an assessment of natural markings. Aquat. conserv. mar. freshwat. ecosyst. 24(1), 11–22 (2014). doi:10.1002/aqc.2427.11
SK Katona, B Baxter, O Brazier, S Kraus, J Perkins, H Whitehead, Identification of humpback whales by fluke photographs. Behav. mar. animals. 3, 33–44 (1979). doi:10.1007/978-1-4684-2985-5_2.11
E Niest, D Burns, P Harrison, Fluke matcher: a computer-aided matching system for humpback whale (Megapteranovaeangliae) flukes. Mar. mamm. sci. 26(3), 744–756 (2010). doi:10.1111/j.1748-7692.2009.00368.x
D Gendron, A Ugalde De La Cruz, A new classification method to simplify blue whale photo-identification technique. J. cetacean res. manag. 12(1), 79–84 (2012)
BE Carvajal-Gamez, FJ Gallegos-Funes, AJ Rosales-Silva, Color local complexity estimation based steganographic (CLCES) method. Expert systs. appl. 40, 1132–1142 (2013). doi:10.1016/j.eswa.2012.08.024
AK Jain, Data clustering: 50 years beyond K-means. Pattern recogn. lett. 31, 651–666 (2010). doi:10.1016/j.patrec.2009.09.011
F Zhao, J Fan, H Liu, Optimal-selection-based suppressed fuzzy C-means clustering algorithm with self-tuning non local spatial information for image segmentation. Expert systs. appl. 41, 4083–4093 (2014). doi:10.1016/j.eswa.2014.01.003
M Honma, T Nose, S Sato, Optical Haar wavelet for extracting edge features along arbitrary directions. Opt. rev. 7(I), 9–13 (2000). doi:10.1007/s10043-000-0009-x
L Wu-Ja, L Ja-Chen, Color quantization by preserving color distribution features. Signal. process. 78, 201–214 (1999). doi:10.1016/S0165-1684(99)00060-2
D Mújica-Vargas, F Gallegos-Funes, A Rosales-Silva, J De Jesus Rubio, Robust c-prototypes algorithms for color image segmentation. EURASIP j. image. video. process. 63, 1–12 (2013). doi:10.1186/1687-5281-2013-63
A Fathi, A Naghsh-Nilchi, Automatic wavelet-based retinal blood vessels segmentation and vessel diameter estimation. Biomed. signal process. control 8, 71–80 (2013). doi:10.1016/j.bspc.2012.05.005
RM Aliguliyev, Performance evaluation of density-based clustering methods. Inform. sci. 179, 3583–3602 (2009). doi:10.1016/j.ins.2009.06.012
D Faraggi, B Reiser, Estimation of the area under the ROC curve. Stat. med. 21, 3093–3106 (2002)
Yurkov A. O., ChernukhaI. V. , Automated Identification and Recognition of Right Whales, Theoretical and Applied Aspects of Cybernetics, 59-69,(2015), ISBN 978-966-399-702-5
S. Hale, Unsupervised threshold for automatic extraction of dolphin dorsal fin outlines from digital photographs in DARWIN, Senior thesis, 2008
Acknowledgements
This research was funded by the Instituto Politécnico Nacional (National Polytechnic Institute of México) and Consejo Nacional de Ciencia y Tecnología (National Council for Science and Technology) for the help and support for project number 221284.
Funding
This research was carried out under financial economic funding provided by Consejo Nacional de Ciencia y Tecnología de México throught project number 221284.
Authors’ contributions
BECG carried out the studies concerning complex media image processing and development of new algorithms for image filtering and participated in the development of filtering algorithm for dynamic histogram. She participated in designing the study and development, which also helped to draft the article. DBTS carried out the studies concerning the development of data clustering algorithms for image classification in complex media and participated in the design and development of the study of clustering techniques also which helped and contributed in drafting the article. DG carried out the studies concerning the visual recognition of the blue whale for longer than 25 years, has proposed and validated characteristics that have served as standards for recognition and classification of the blue whale in their habitat, and also helped draft and correct the article. FJGF carried out relating to the image processing complex media studies and the development of new algorithms for image filtering and participated in the development of filtering algorithm for dynamic histogram and clustering. He has extensive experience in image processing and in pattern recognition, participated in designing the study and its development, and helped to draft, correct, and improve the article. All authors read and approved the final manuscript.
Competing interests
The authors declare that they have no competing interests.
Author information
Authors and Affiliations
Corresponding author
Rights and permissions
Open Access This article is distributed under the terms of the Creative Commons Attribution 4.0 International License (http://creativecommons.org/licenses/by/4.0/), which permits unrestricted use, distribution, and reproduction in any medium, provided you give appropriate credit to the original author(s) and the source, provide a link to the Creative Commons license, and indicate if changes were made.
About this article

Cite this article
Carvajal-Gámez, B.E., Trejo-Salazar, D.B., Gendron, D. et al. Photo-id of blue whale by means of the dorsal fin using clustering algorithms and color local complexity estimation for mobile devices. J Image Video Proc. 2017, 6 (2017). https://doi.org/10.1186/s13640-016-0153-2
Received:
Accepted:
Published:
DOI: https://doi.org/10.1186/s13640-016-0153-2